ELFIE
US Water Budgets Demo
Use Case Descrition
This use case provides a person interested in a basic summary of the water budget information about a collection of watersheds and their water budget data. It links together various hydrographic representations of each watershed as well as observational water budget data and related web resources.
The demo is available as a static data visualization
User Story
A person curious about what a watershed looks like and how it’s waterbudget compares to other watersheds needs relevant hydrographic and hydrologic datasets linked together and built into a visualization.
Datasets
- Watershed boundaries (HY_CatchmentBoundary)
- River Network (HY_HydrographicNetwork)
- Watershed outlet (HY_Nexus location)
- Waterbudget Components
- Links to related resources
Demo Description and Links
This demonstration tests the ELFIE JSON-LD formats by leveraging ELFIE demo JSON-LD files to create geospatial visualizations of watersheds (HY_Catchment features with multiple realizations) and high level summaries of water budget components. It was implemented in R, using the USGS VizLab framework. Geospatial content is derived directly from the preview geometries in the JSON-LD files and waterbudget data is accessed via linked resource URLs. This demo involves both HY_Features relationships between catchments and their realizations and HY_Features nexus locations and observed water budget components linked to those locations.
Demo Screenshot(s)
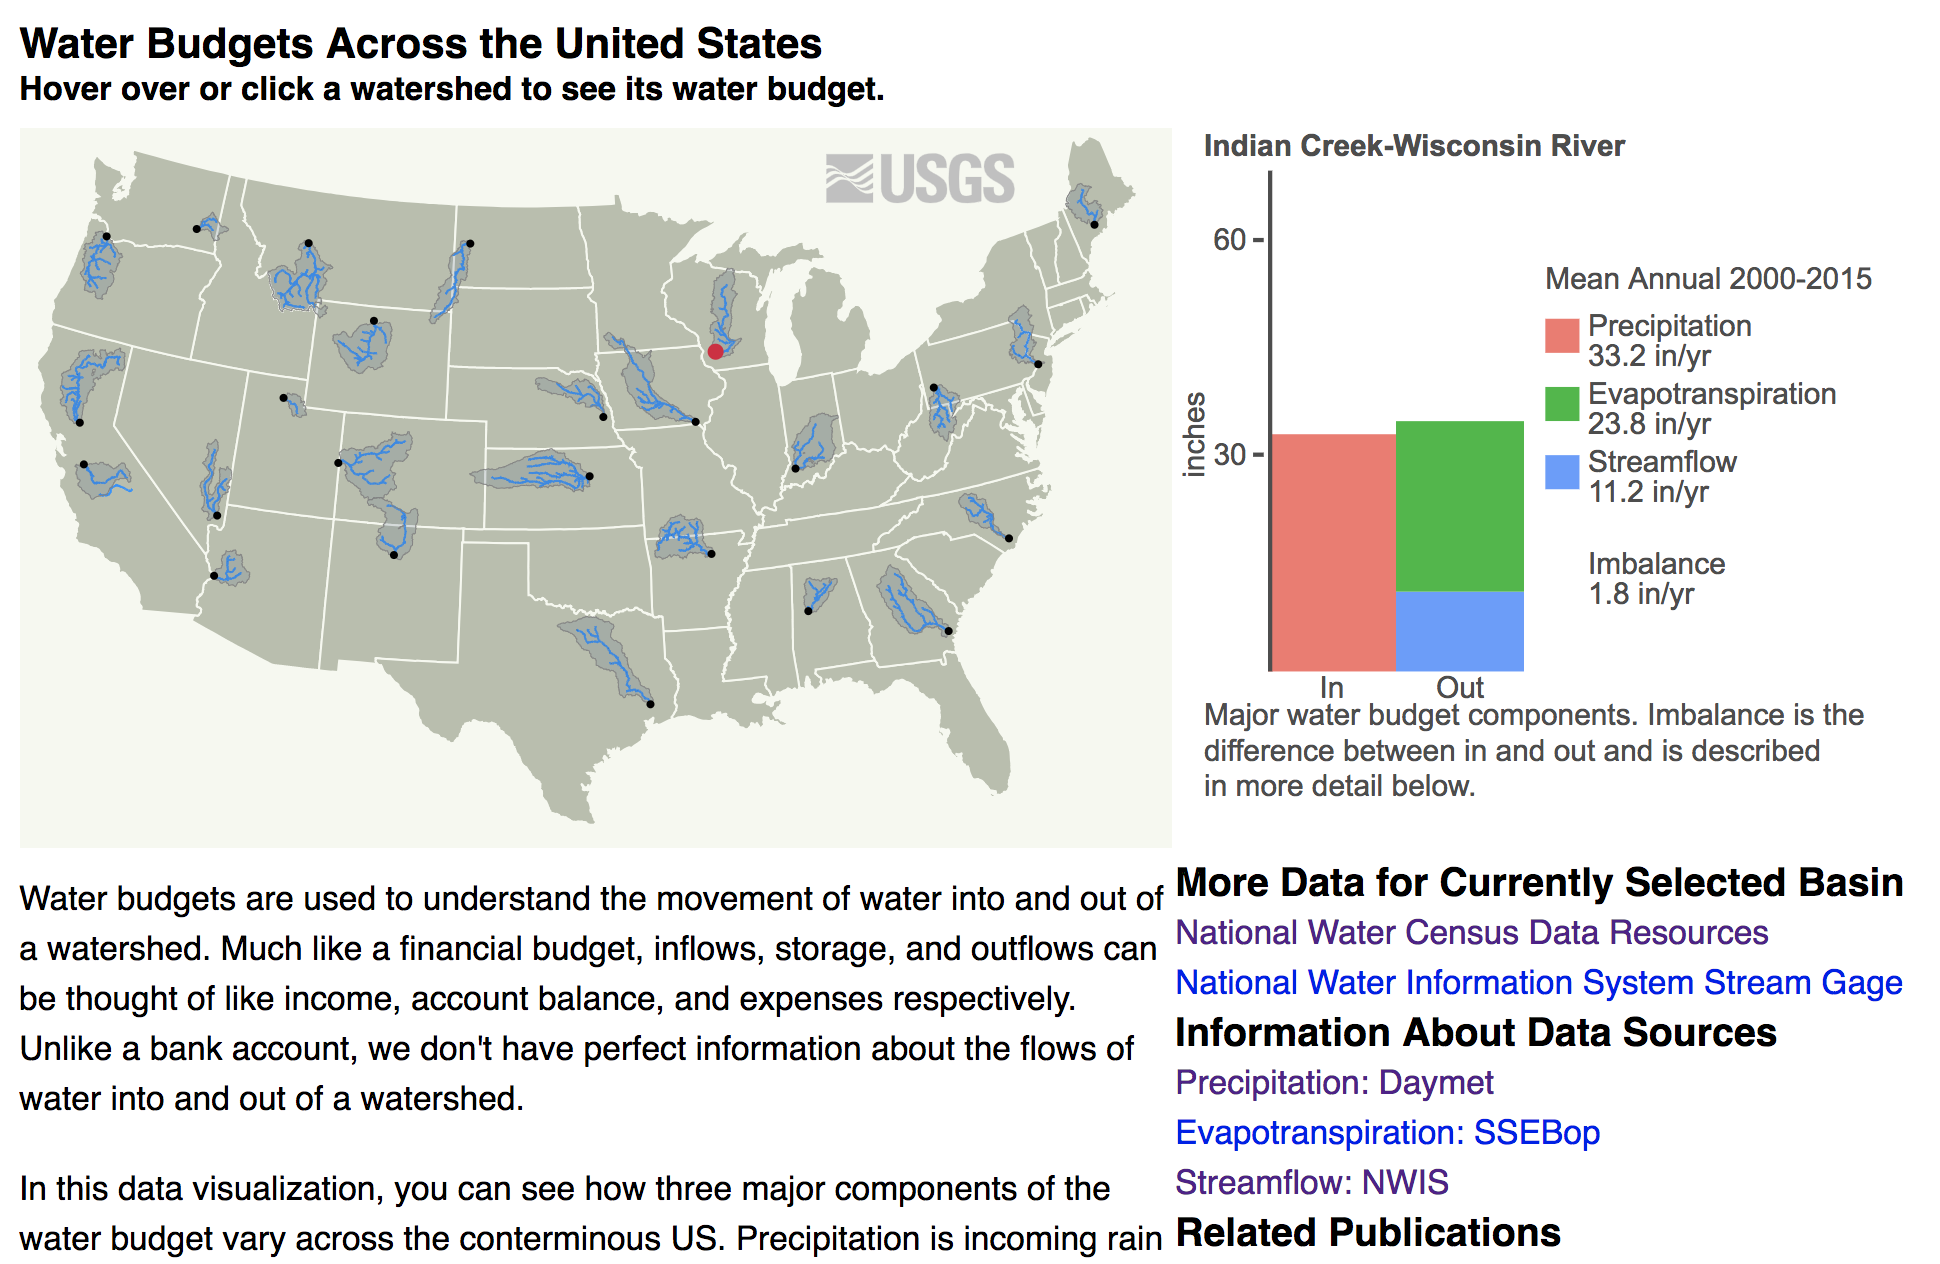
The US Water Budgets demo is a static HTML and SVG visualization of various ELFIE linked resources.
Links to Demo Resources
The data index for the USWB demo can be seen in github here.
The primary entry point to the data is the non-spatial set of catchments as can be seen in this tsv file.
Each catchment is linked to three spatial features, an outflow, a flowline network, and a boundary polygon. This can be seen in a JSON-LD document such as this one.
Navigate to the use case data home on github and go to the
usgs_huc12boundary_uswb .tsv
or .json files to see the data
that is in the demo ELFIE JSON-LD documents such as this one.
This collection of files is accessed with R code that builds the map in the data visualization that can be seen here.
Demo findings and potential next steps
This demonstration has shares a lot with the watershed data index demo, so findings are similar. A lack of canonical URIs for the watersheds and data resources related to them is a necessary condition for broad implementation. An issue that is unique to this demo is around monitoring relationships. The precipitation and evapotranspiration water budget component data are estimated using remote sensing and aggregated to a watershed, are linked to the outlet of the watershed the same way as streamflow is. While practically correct, because hydrology phenomena can be summarized at a watershed outlet, this does not tell the whole story. A data model focused on waterbudget components would be helpful to solve this deficiency.