ELFIE
Surface-ground water networks interaction Demo
Use Case Descrition
This use case is meant to demonstrate how from a given Piezometer URI any user (domain expert, machine) can traverse to the ground water monitoring strategy (see Ground water level monitoring Use Case) but also to the associated surface water monitoring one. Provided each surface/groundwater features are propertly linked together (River network, Aquifer system) it is then feasible to acquire knowledge about a fully comprehensive water system. This use case can be seen as a flagship one to demonstrate the usefulness of linked data in the environnemental context.
The demo is available as a set of 2 videos
User Story
From a given piezometer, a user needs to access to a comprehensive description of the surface/ground water system involved.
Datasets
- Piezometer (SOSA:Sample),
- River Gage (SOSA:Sample, HY_Features:HY_HydrometricFeature),
- Waterbody (HY_Features:HY_WaterBody)
- Aquifer (GWML2:GW_HydrogeoUnit)
Demo Description and Links
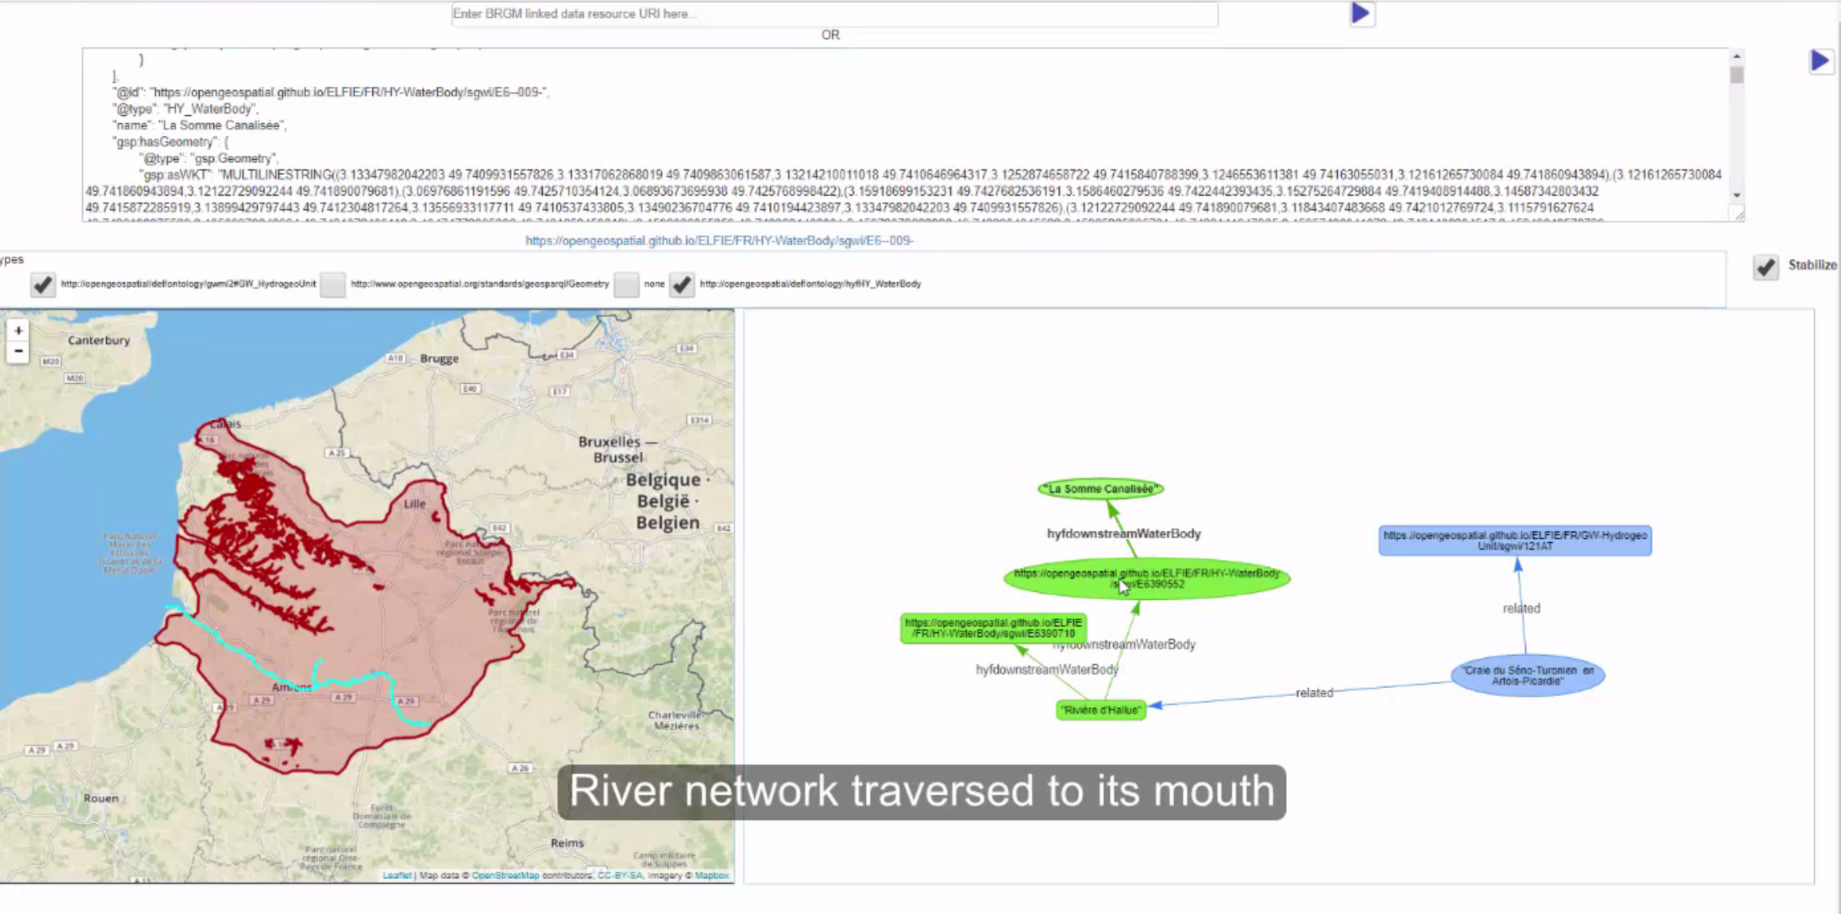
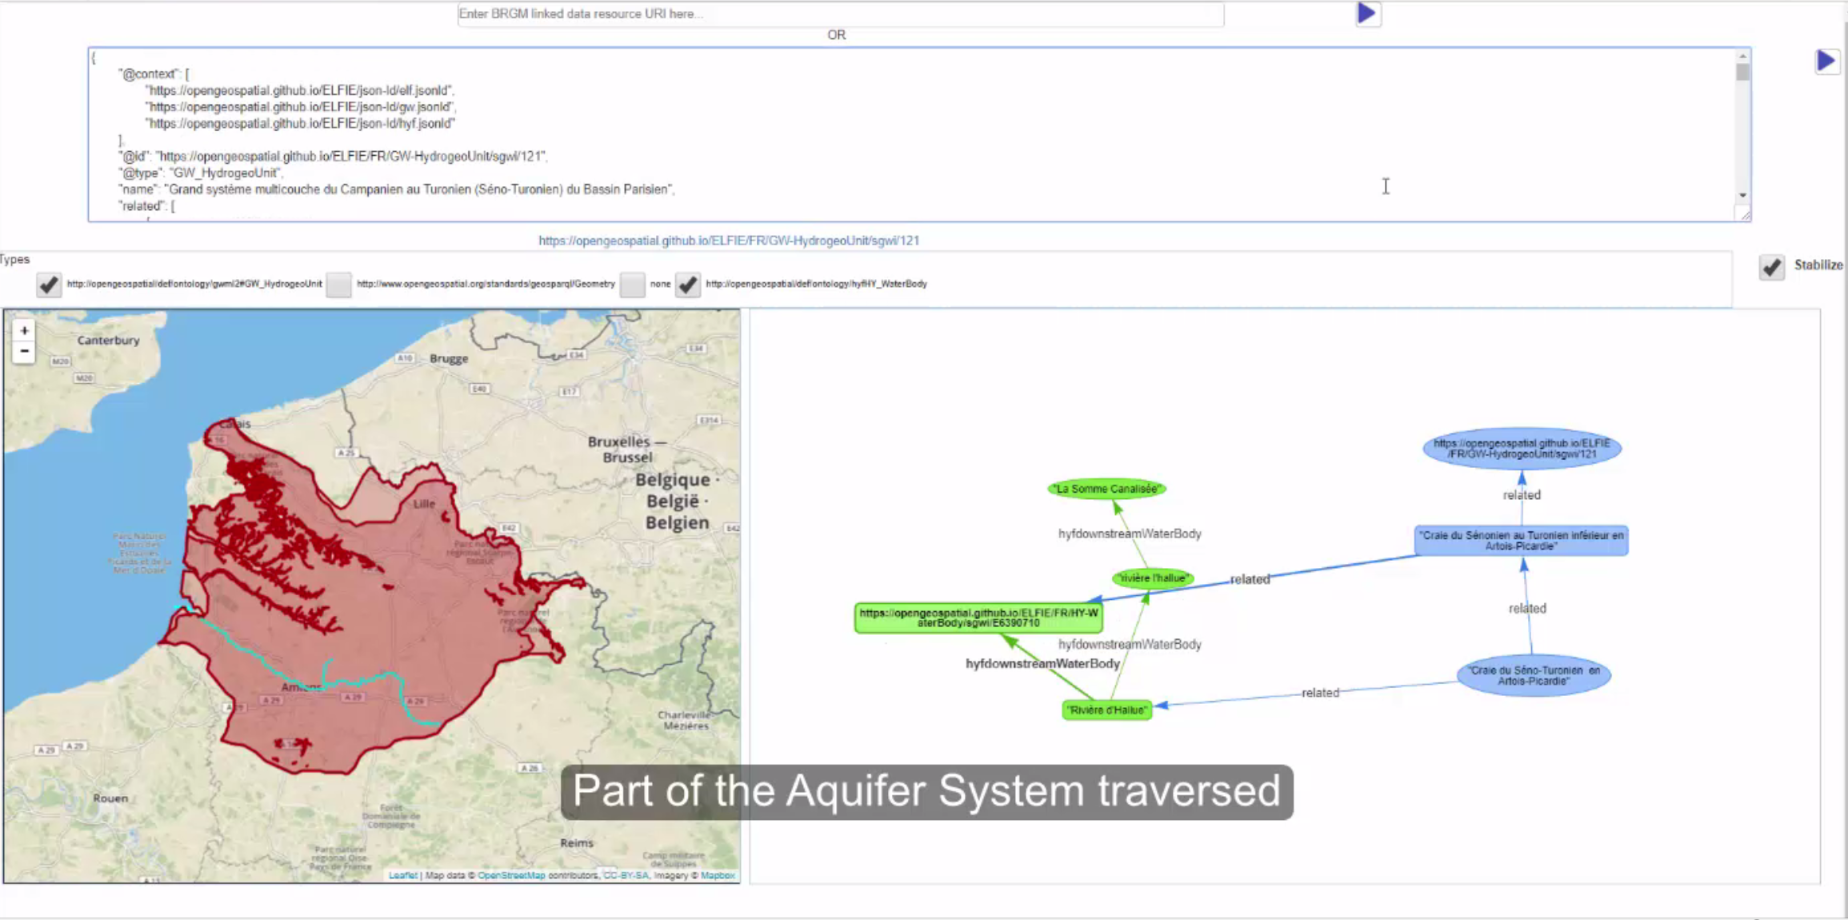
This use case is meant to demonstrate the combination of the use of W3C:SOSA, tentative OGC:GroundWaterML2, OGC:HY_Features and OGC:ELFIE json-ld contexts to access and navigate though data representing a complete surface/ground water system covering an important part of France. Starting from a single ‘information seed’, it is possible to traverse to the far end of the AquiferSystem and to the mouth of the River ultimately involved.
In this demonstration, SOSA terminology is used to describe both the piezometer and the river gage (O&M Sampling features). It also enables to link them to the domain features they respectively monitor (the aquifer and the waterbody) and the produced observations. SOSA’s sampling:relatedSample used to link SOSA Sample together and skos:related to link groundwater and surfacewater features together
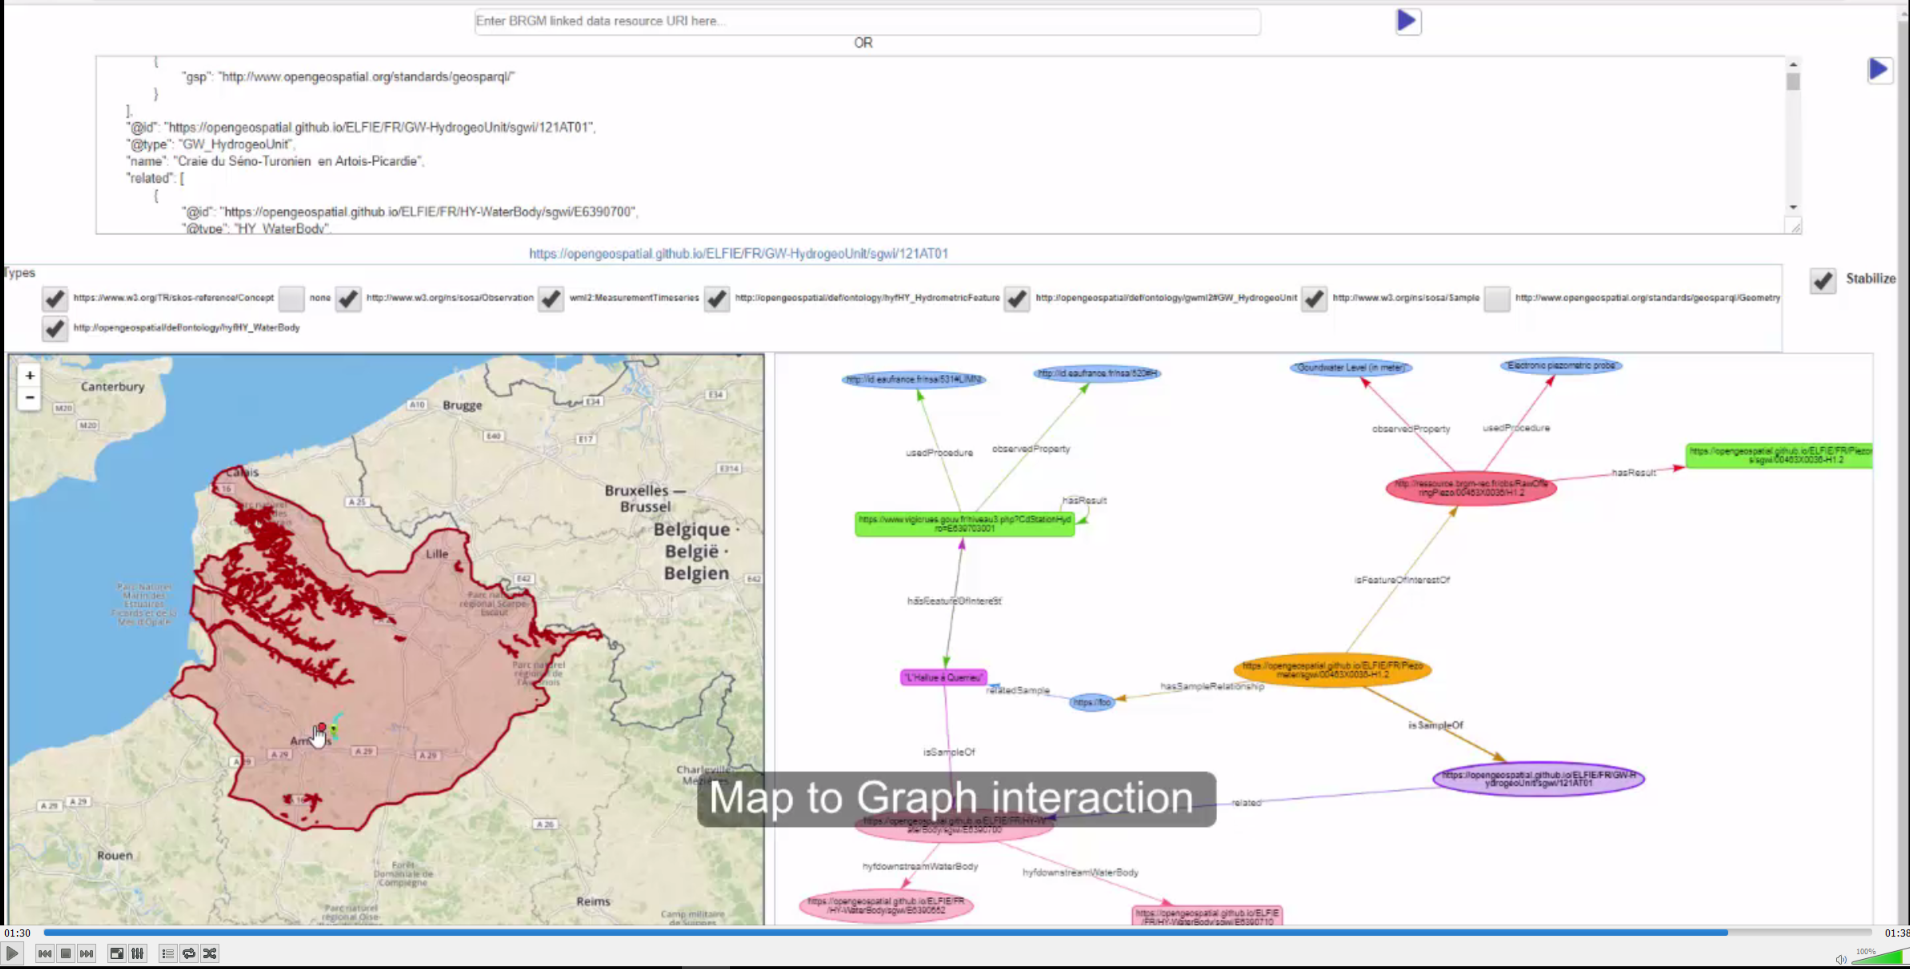
The demonstration makes use of BRGM experimental Linked Data Viewer (BLiV) that was developped as a support to ELFIE activities. Given that content is highly typed (@type) it was tried to see to what extent content driven widgets could be fed by a data graph (here : adding features to a map and enriching the data graph).
Demo Screenshot(s)
The ground water monitoring demo is a mashup involving a graph library (viz.js), a map viewer (leaflet), json-ld library (jsonld.js).
Links to Demo Resources
The data index can be seen in github here.
Every feature being linked there are several potential entry points
- the Piezometer that can be seen in this json-ld document. . It is linked to the Aquifer, the observations acquired and the HydroStation.
- the HydroStation (river gage) that can be seen in this json-ld document.. It is linked to the Waterbody, the observations acquired and the Piezometer.
- the Aquifer that can be seen in this json-ld document.. It is linked to related HydroGeoUnit in the Aquifersystem and the related Waterbody.
- the Waterbody that can be seen in this json-ld document.. It is linked to related Waterbod(ies)y in the river network. Some are related to other HydroGeoUnits in the AquiferSystem.
Interaction with the json-ld content can be experienced using BRGM experimental Linked Data Viewer (BLiV) which code is available on ELFIE github repository here.. JSON-LD content just need to be pasted in the dedicated area.
Demo findings and potential next steps
Setting up the demo proved that actually trying to consume the JSON-LD files helped design and populate them.
It provides another way to discover and interact with surface ground interaction data that are usually mainly described in domain experts reports. And, in turn, helps demonstrate the usefulness of linked data on those information silos.
In order to move this demo to production, several aspects need to be covered, such as,
- deploying the JSON-LD layer on top of the identified silos, applying the ELFIE patterns
- refining the GUI behaviour especially when data graph become highly populated
Discuss issues that this demo works around or would otherwise need to be solved to take it from demonstration/experiment to production.