ELFIE
Ground water monitoring Demo
Use Case Descrition
This use case is meant to demonstrate how from a given Well URI, any user (domain expert, machine) can then traverse to the monitoring strategy deployed and then access to the ground water level time series. Further than advocating the linked data approach it serves as a demonstration artifact on how typed information can trigger type-specific data viewer (here map and time series).
The demo is available as a video .
User Story
From a given groundwater well, a user needs to access to the sampling strategy and associated observations of a given aquifer monitored in France.
Datasets
- Borehole (SOSA:Sample, GWML2:GW_Well)
- Piezometer (SOSA:Sample)
- Aquifer (GWML2:GW_HydrogeoUnit)
- GroundWater level (OGC SensorThings response to a request for observations)
Demo Description and Links
This use case is meant to demonstrate the combination of the use of W3C:SOSA, tentative OGC:GroundWaterML2 and OGC:ELFIE json-ld contexts to access and navigate though data representing the groundwater monitoring environnement of a given aquifer in France. In this demonstration, SOSA terminology is used to link the piezometer (O&M Sampling feature) to the domain features it monitors (the Aquifer) but also to the observations generated. It was decided that the observation will be served here following an OGC:SensorThings approach.
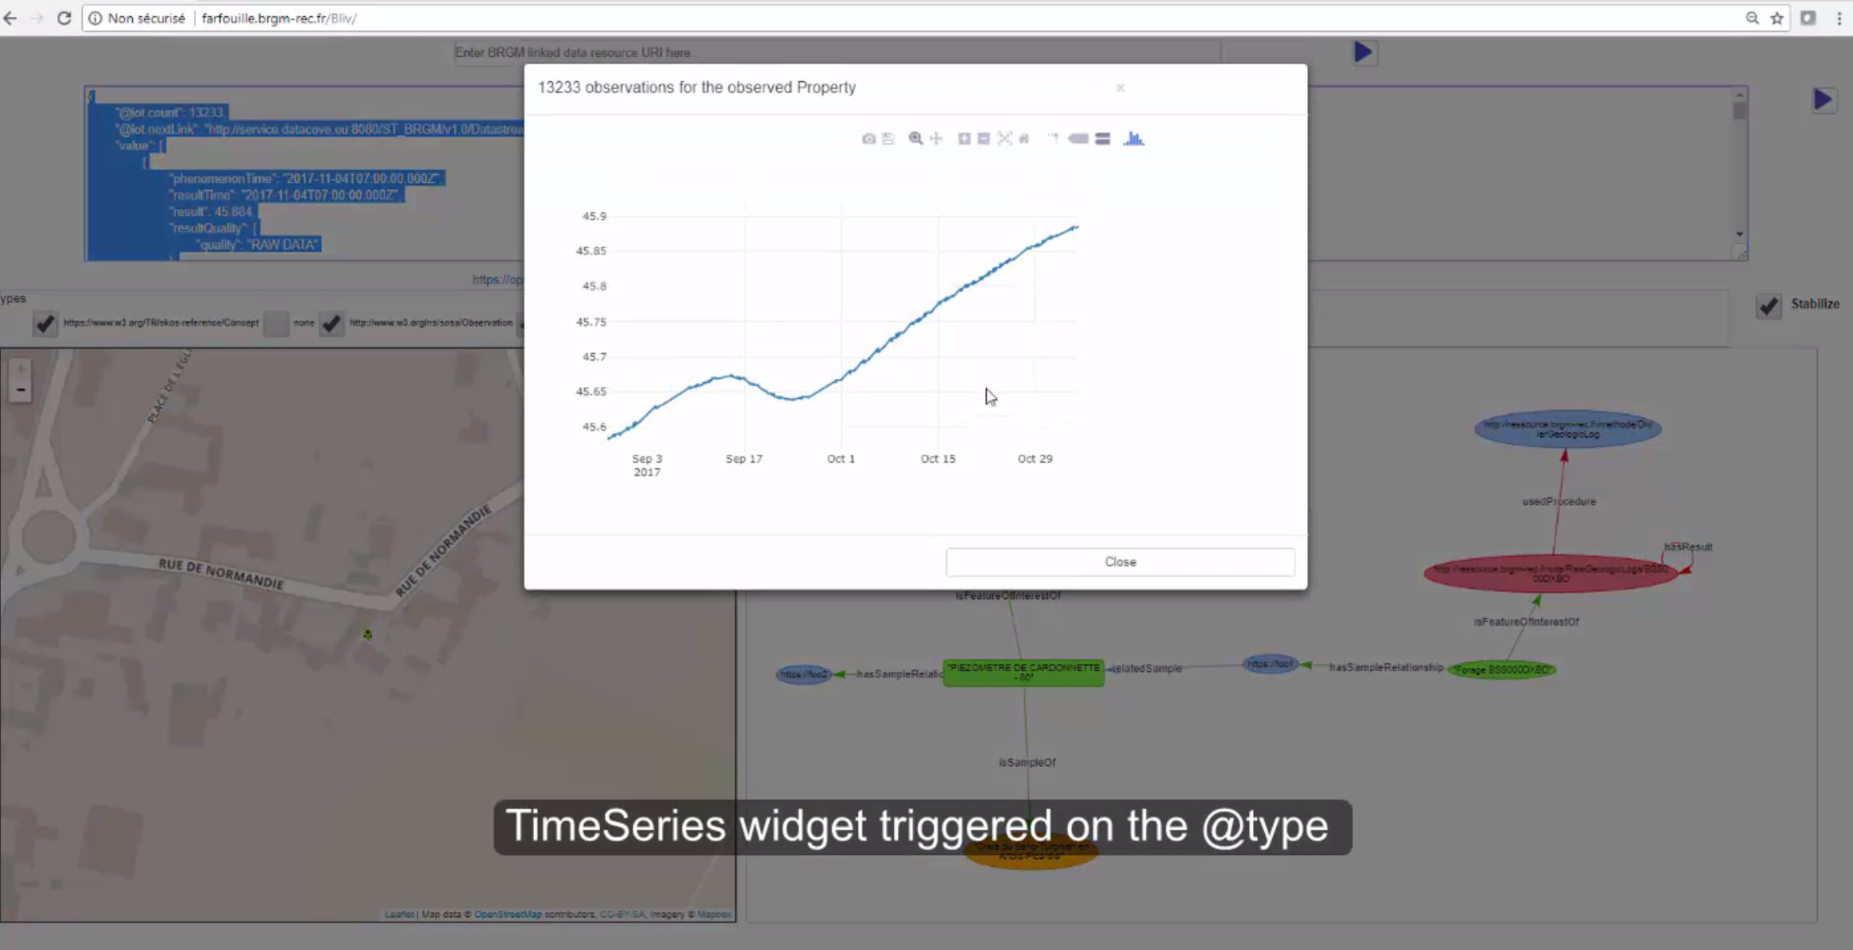
The demonstration makes use of BRGM experimental Linked Data Viewer (BLiV) that was developped as a support to ELFIE activities. Given that content is highly typed (@type) it was tried to see to what extent content driven widgets could be fed by a data graph (adding features to a map, viewing a timeseries graph).
Demo Screenshot(s)
The ground water monitoring demo is a mashup involving a graph library (viz.js), a map viewer (leaflet), json-ld library (jsonld.js) and timeseries representation using plot.ly.
Links to Demo Resources
The data index can be seen in github here.
The primary entry point to the data is the Borehole that can be seen in this json-ld document.
The Borehole is linked to two features, a piezometer, and a geology log.
Interaction with the json-ld content can be experienced using BRGM experimental Linked Data Viewer (BLiV) which code is available on ELFIE github repository here.. JSON-LD content just need to be pasted in the dedicated area.
Demo findings and potential next steps
Setting up the demo proved that actually trying to consume the JSON-LD files helped design and populate them.
It provides a really fast way to discover and interact with groundwater monitoring data. Domain experts don’t have to go through various discovery layers (CSW, WFS, SOS/SensorThingAPI). Here, given that each information element is properly linked to the others through their URIs, data content is properly contextualized and accessible ‘in a click’. It is also a wonderful discussion material with domain colleagues to demonstrate the usefulness of linked data on their information silos.
In order to move this demo to production, several aspects need to be covered, such as,
- deploying the JSON-LD layer on top of the identified silos, applying the ELFIE patterns,
- putting URIs on timeseries (or subset of) which is a topic of its own,
- refining the GUI behaviour especially when data graph become highly populated.